Exploratory Data Analysis of a Movie Dataset
Exploratory Analysis is a crucial step in Data Analysis process. It involves summarizing, investigating and visualising data to understand its characteristics and identify tends and patterns.
The dataset was downloaded from Kaggle.
1
2
3
4
5
#importing the required libraries
import pandas as pd
import numpy as np
import matplotlib as plt
1
2
3
4
5
6
#loading and viewing movie data
df = pd.read_csv("archive/movie.csv")
# df.head()
# df.shape[0]
df[df.columns[0]].count()
df
| movieId | title | genres | |
|---|---|---|---|
| 0 | 1 | Toy Story (1995) | Adventure|Animation|Children|Comedy|Fantasy |
| 1 | 2 | Jumanji (1995) | Adventure|Children|Fantasy |
| 2 | 3 | Grumpier Old Men (1995) | Comedy|Romance |
| 3 | 4 | Waiting to Exhale (1995) | Comedy|Drama|Romance |
| 4 | 5 | Father of the Bride Part II (1995) | Comedy |
| ... | ... | ... | ... |
| 27273 | 131254 | Kein Bund für's Leben (2007) | Comedy |
| 27274 | 131256 | Feuer, Eis & Dosenbier (2002) | Comedy |
| 27275 | 131258 | The Pirates (2014) | Adventure |
| 27276 | 131260 | Rentun Ruusu (2001) | (no genres listed) |
| 27277 | 131262 | Innocence (2014) | Adventure|Fantasy|Horror |
27278 rows × 3 columns
1
2
3
4
5
6
7
#splitting the title column into title and year column
split_title = df['title'].str.rsplit(' ', n=1, expand=True).fillna("")

df['title'] = split_title[0]
df['year'] = split_title[1]

df
| movieId | title | genres | year | |
|---|---|---|---|---|
| 0 | 1 | Toy Story | Adventure|Animation|Children|Comedy|Fantasy | (1995) |
| 1 | 2 | Jumanji | Adventure|Children|Fantasy | (1995) |
| 2 | 3 | Grumpier Old Men | Comedy|Romance | (1995) |
| 3 | 4 | Waiting to Exhale | Comedy|Drama|Romance | (1995) |
| 4 | 5 | Father of the Bride Part II | Comedy | (1995) |
| ... | ... | ... | ... | ... |
| 27273 | 131254 | Kein Bund für's Leben | Comedy | (2007) |
| 27274 | 131256 | Feuer, Eis & Dosenbier | Comedy | (2002) |
| 27275 | 131258 | The Pirates | Adventure | (2014) |
| 27276 | 131260 | Rentun Ruusu | (no genres listed) | (2001) |
| 27277 | 131262 | Innocence | Adventure|Fantasy|Horror | (2014) |
27278 rows × 4 columns
1
2
3
4
5
#Removing the parenthesis from the year column
import re
pattern = r"[()]"
df['year'] = df['year'].str.replace(pattern,"",regex=True)
df
| movieId | title | genres | year | |
|---|---|---|---|---|
| 0 | 1 | Toy Story | Adventure|Animation|Children|Comedy|Fantasy | 1995 |
| 1 | 2 | Jumanji | Adventure|Children|Fantasy | 1995 |
| 2 | 3 | Grumpier Old Men | Comedy|Romance | 1995 |
| 3 | 4 | Waiting to Exhale | Comedy|Drama|Romance | 1995 |
| 4 | 5 | Father of the Bride Part II | Comedy | 1995 |
| ... | ... | ... | ... | ... |
| 27273 | 131254 | Kein Bund für's Leben | Comedy | 2007 |
| 27274 | 131256 | Feuer, Eis & Dosenbier | Comedy | 2002 |
| 27275 | 131258 | The Pirates | Adventure | 2014 |
| 27276 | 131260 | Rentun Ruusu | (no genres listed) | 2001 |
| 27277 | 131262 | Innocence | Adventure|Fantasy|Horror | 2014 |
27278 rows × 4 columns
1
2
3
4
5
6
7
#extracting all the unique genres from the genres col.
#since some of them have multiple genres in a single cell

genres_list = df["genres"].str.split("|").sum()
unique_genres = list(set(genres_list))

print(unique_genres)
1
['Sci-Fi', '(no genres listed)', 'Romance', 'Mystery', 'Musical', 'Horror', 'Children', 'IMAX', 'Documentary', 'Comedy', 'Animation', 'Fantasy', 'Film-Noir', 'Adventure', 'Western', 'Thriller', 'Crime', 'War', 'Action', 'Drama']
1
2
3
4
5
6
#using the unique genres extracted earlier as the definition
#to count the number of occurance of each genres

df_genres = df["genres"].str.split("|").explode() #splits each genres into separate items
genre_counts = df_genres[df_genres.isin(unique_genres)].value_counts()
print(genre_counts)
1
2
3
4
5
6
7
8
9
10
11
12
13
14
15
16
17
18
19
20
21
22
genres
Drama                 13344
Comedy                 8374
Thriller               4178
Romance                4127
Action                 3520
Crime                  2939
Horror                 2611
Documentary            2471
Adventure              2329
Sci-Fi                 1743
Mystery                1514
Fantasy                1412
War                    1194
Children               1139
Musical                1036
Animation              1027
Western                 676
Film-Noir               330
(no genres listed)      246
IMAX                    196
Name: count, dtype: int64
1
2
#Plotting the count of each genres
genre_counts.plot(kind="bar", color="skyblue")
1
<Axes: xlabel='genres'>
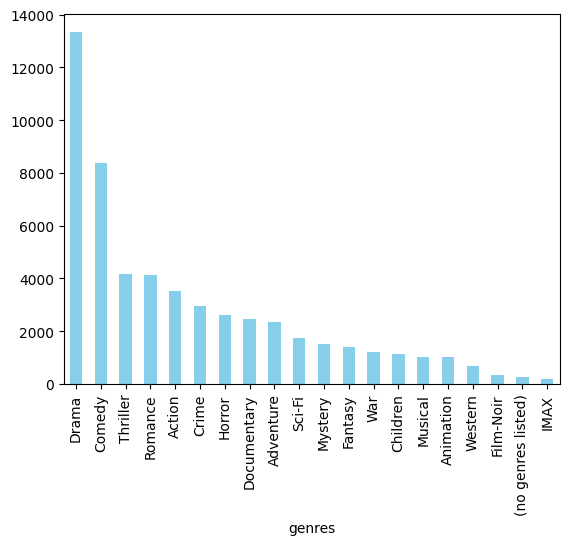 Count of Each Genres
This post is licensed under CC BY 4.0 by the author.